Topics: Finance & Accounting Outsourcing, Senior Housing
Posted on August 03, 2026
Written By Punit Somani




Community-level EBITDA is one of the most familiar numbers in a senior living board pack. It is clean, comparable, and easy to explain. A community is either ahead of plan or behind plan; margin is either expanding or compressing; leadership can quickly rank “winners” and “watchlist” assets. But in today’s senior living environment, that simplicity can become dangerous.
EBITDA is useful because it strips out interest, taxes, depreciation, and amortization to provide a view of operating profitability; however, it is not a GAAP or IFRS-recognized metric, has no universally accepted formula, and does not show actual cash generated by operations in the same way operating cash flow does.
That distinction matters in senior living because the economics of a community are shaped by more than reported earnings: staffing volatility, payer mix, rate integrity, CapEx needs, regional occupancy trends, collections, care acuity, and reimbursement exposure all affect financial durability.
The sector’s headline indicators look encouraging. NIC MAP reported that senior housing occupancy reached 89.1% in Q4 2025, with independent living at 90.6% and assisted living at 87.7%, alongside 4.4% annual rent growth. JLL’s Spring 2026 seniors housing outlook similarly noted primary-market occupancy of 89.9% and secondary-market occupancy of 90.0% in Q4 2025, supported by 19 consecutive quarters of positive absorption. Yet stronger occupancy does not automatically mean lower portfolio risk. In fact, when demand is improving, community-level EBITDA can make risk harder to see because growth can temporarily mask cost leakage, labor inefficiency, underpriced care, or deteriorating asset quality.
At the community level, EBITDA answers a narrow question: “Is this location generating operating earnings?” At the portfolio level, CFOs and owners need a more strategic question: “Is this earnings base durable, repeatable, cash-convertible, and scalable across markets?” Those are not the same.
A community may post improving EBITDA because occupancy is rising, while its labor model is becoming more fragile. Another may show stable EBITDA because rent increases are covering cost inflation, while move-in concessions are weakening future rate integrity.
A third may appear healthy because CapEx is deferred, even though the building is aging and future reinvestment needs are building beneath the P&L. EBITDA can also flatten differences between a community that is genuinely operationally efficient and one that is simply benefiting from market-level demand.
This is why portfolio-level analysis cannot stop at EBITDA. It must connect EBITDA to NOI, operating margin, labor cost exposure, revenue per occupied unit, agency usage, AR aging, payer mix, care-level profitability, CapEx reserve needs, and regional market conditions.
Baker Tilly notes that capital providers increasingly prioritize visibility into NOI and margin stability, occupancy in context, labor cost exposure, liquidity and receivables, and regulatory or quality indicators when evaluating senior living organizations.
Labor is the clearest example of why EBITDA needs context. Ziegler’s 2025 CFO Hotline survey found that employee compensation consumed 56.1% of overall budgets on average across senior living and care respondents, with 96% reporting total staffing cost increases over the prior 12 months.
The same survey showed meaningful turnover across key roles, including combined average turnover of 44.2% for CNAs, 36.4% for RNs, and 40.0% for dining staff.
Community-level EBITDA may show whether those costs are absorbed in the current period, but it does not reveal whether the labor model is sustainable. A community can hit its EBITDA target while relying on overtime, agency labor, or understaffing that creates resident experience, compliance, and retention risk.
In skilled nursing, AHCA reported that 99% of nursing homes had open jobs, 90% had increased wages in the prior six months, 46% had limited new admissions, and 45% were operating at a loss or negative total margin in its 2024 State of the Sector survey.
Even where senior housing differs from nursing homes in payer and care model, the lesson for operators is relevant: labor risk is both financial and operational.
The FP&A implication is straightforward: EBITDA should be accompanied by labor productivity metrics. CFO dashboards should track total labor cost as a percentage of revenue, wage and benefit cost per occupied unit, overtime percentage, agency spend, hours per resident day, open roles by community, turnover by role, and staffing variance versus acuity.
A community that “meets EBITDA” through unstable labor economics should not be scored the same as one that protects margin through disciplined scheduling and retention.
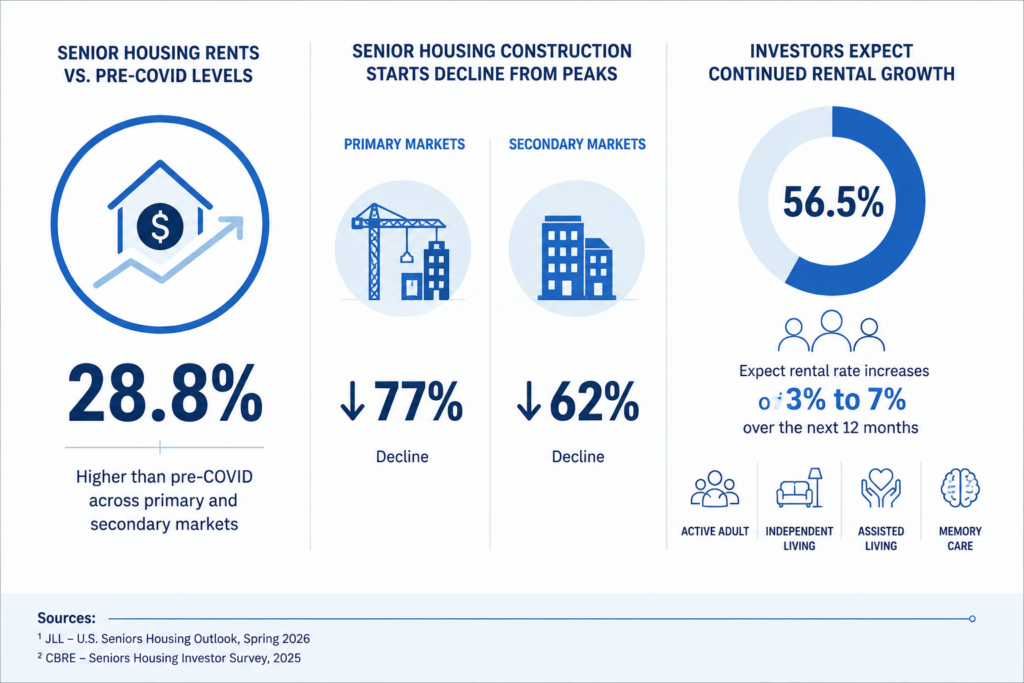
Occupancy recovery is real, but occupancy alone is not margin quality. JLL reported that senior housing rents were 28.8% higher than pre-COVID levels across primary and secondary markets, while construction starts declined 77% in primary markets and 62% in secondary markets from recent peaks.
CBRE also found that senior housing investors expect continued rental growth, with 56.5% of survey respondents expecting rental rate increases of 3% to 7% over the next 12 months for active adult, independent living, assisted living, and memory care facilities.
For operators, this creates both opportunity and risk. If EBITDA improves because rents are rising faster than expenses, the portfolio may look stronger. But if that improvement depends on select markets with constrained supply, or on rate increases that may not be repeatable, the board needs to know.
Portfolio analysis should distinguish between EBITDA generated by sustainable occupancy and rate integrity versus EBITDA supported by short-term pricing power, delayed expenses, or concessions.
That means dashboards should separate occupancy into paid occupancy, economic occupancy, move-ins, move-outs, net absorption, concessions, revenue per occupied unit, care-level capture, and market-level occupancy benchmarks. A regional view matters because JLL noted that occupancy recovery still varies across markets, with many West Coast markets continuing to lag the rest of the country. A single community EBITDA number cannot show that pattern.
For operators with skilled nursing exposure, Medicaid and reimbursement dynamics add another layer. KFF reported that Medicaid was the primary payer for over 6 in 10 nursing facility residents as of July 2024 and paid for 44% of the $147 billion the U.S. spent on institutional long-term care in 2023. KFF also noted that most states increased nursing facility fee-for-service base rates in FY 2024 and FY 2025 in response to staffing shortages.
At the community level, payer mix may show up as revenue and margin. At the portfolio level, it is a concentration risk. A portfolio with similar EBITDA across communities may carry very different reimbursement exposure depending on geography, Medicaid reliance, managed care penetration, private-pay mix, and denial trends.
Without payer-level dashboards, CFOs may not see margin risk until reimbursement changes, collection delays, or staffing mandates begin affecting cash flow.
The right portfolio lens tracks payer mix by community, payer margin, AR aging by payer, denial rate, write-offs, Medicaid rate assumptions, managed care utilization, and reimbursement variance versus forecast. EBITDA should be reconciled to cash collection quality, not just revenue recognition.
Community-level EBITDA can also understate future reinvestment needs. AEW’s Q3 2025 senior housing research noted that approximately half of seniors housing inventory is now 25 years or older, while 2025 construction starts totaled just over 6,000 units, representing only 0.6% of existing inventory.
Older inventory can generate acceptable EBITDA today while requiring significant future capital to remain competitive, compliant, and operationally efficient.
This is a classic portfolio blind spot. If leadership evaluates communities only on EBITDA, underinvestment can appear to improve performance. In reality, deferred CapEx may be weakening future occupancy, resident experience, pricing power, and exit value. A more complete portfolio view should pair EBITDA with maintenance CapEx, replacement reserves, asset age, renovation backlog, life-safety requirements, capital spend per unit, and ROI on renovations.
Portfolio-level EBITDA analysis is not simply summing community EBITDA. It is a structured view of earnings quality across cohorts. The goal is to understand where performance is coming from, which drivers are repeatable, and where risk is building.
A useful framework has four layers:
Internally, QX’s senior living data visibility work emphasizes that finance leaders need connected views of occupancy, move-ins, rate growth, labor hours, overtime, agency usage, acuity mix, collections, AR aging, property-level expenses, and community-level EBITDA/NOI trends—not static monthly financials alone.
It also highlights the need for standardized KPIs, consistent chart of accounts, faster close cycles, integrated financial and operational data, variance commentary, dashboards, automated workflows, and stronger data governance.
The best senior living finance teams are moving from reporting EBITDA to managing EBITDA quality. That requires an EPM discipline: standardized definitions, driver-based forecasting, controlled variance commentary, and business intelligence that connects finance, labor, occupancy, billing, and operations.
A practical operating cadence could look like this:
FP&A in senior living should support budgeting, forecasting, financial modeling, performance analysis, cost optimization, liquidity planning, and investment decisions across communities. The real value is not another dashboard; it is a decision system that helps executives identify where EBITDA is strong, where it is fragile, and what intervention is needed.
For many operators, the challenge is not knowing which metrics matter. It is building the finance capacity, data discipline, and reporting cadence to produce them consistently. This is where senior living accounting services, outsourced FP&A, and BI support can play a strategic role, not as a replacement for leadership judgment, but as infrastructure for better visibility.
QX Global Group senior living accounting services are positioned around improving financial visibility, digitized reporting, budgeting and forecasting, automation, AP/AR, reconciliations, month-end close, and management accounting for U.S. senior living operators. The most relevant role for a partner like QX is not simply transaction processing; it is helping operators standardize the financial layer beneath portfolio decisions so CFOs can focus on margin quality, risk signals, and performance improvement.
Talk to our experts to learn more!
Community-level EBITDA is a useful starting point, but it is not enough for today’s senior living boardroom. The stronger question is not “Which communities are profitable?” It is: Which communities are creating durable, cash-backed, risk-adjusted earnings and which ones are quietly borrowing performance from labor strain, payer exposure, deferred CapEx, or weak data visibility?
Senior living operators that answer that question with portfolio-level FP&A, BI dashboards, and disciplined EPM will be better positioned to protect margins, satisfy capital partners, and grow without letting hidden risk compound beneath good-looking community EBITDA.
Senior living operators can improve visibility by standardizing financial reporting, consolidating data across communities, and using BI dashboards that connect operational and financial metrics in real time. This enables leadership teams to identify emerging trends, benchmark performance across locations, and take corrective action before issues impact portfolio profitability.
Site-level reporting often highlights individual community performance but may miss broader trends affecting multiple locations, such as labor inflation, reimbursement changes, or regional occupancy shifts. Portfolio-level reporting provides a more strategic view of risk, helping executives understand how local issues accumulate and impact overall financial performance.
Labor costs and reimbursement rates directly influence margins, cash flow, and operating efficiency across the portfolio. Even if individual communities maintain strong EBITDA, rising wages, overtime reliance, payer mix changes, or reimbursement pressures can create significant portfolio-wide profitability risks.
In addition to EBITDA, CFOs should track NOI, labor cost per occupied unit, occupancy rates, revenue per occupied unit, payer mix, AR aging, cash conversion, and overtime or agency labor utilization. These metrics provide deeper insight into whether financial performance is sustainable or masking underlying operational challenges.
Finance leaders can strengthen portfolio analytics by integrating accounting, occupancy, labor, revenue cycle, and budgeting data into a single reporting framework. Leveraging FP&A, BI, and EPM tools allows executives to forecast trends, perform scenario planning, and make more informed decisions based on real-time portfolio performance.
Portfolio-level analytics helps leaders identify which communities, regions, or service lines are generating the strongest returns and which require operational intervention. This enables more effective allocation of capital toward growth opportunities, renovations, acquisitions, staffing investments, and strategic expansion initiatives.
QX Global Group helps senior living operators standardize financial processes, improve reporting accuracy, and consolidate data across communities to create a single source of financial truth. Through accounting support, FP&A expertise, and data-driven reporting solutions, QX enables CFOs to develop executive dashboards that deliver actionable insights into portfolio performance, profitability, and risk.

Education:

Punit has over 15 years of experience partnering with global enterprise clients to reengineer Finance & Accounting operations through digital transformation and offshore delivery models. Known for a consultative, relationship-driven approach, Punit helps organizations build strong business cases that deliver up to 60% cost savings, while improving quality, flexibility, and scalability across finance functions.
Expertise: Finance & Accounting Transformation, AI & Technology in FinOps, End-to-end F&A Services, Offshore Delivery Models, Business Transformation, Real Estate & Asset-Led Sectors
Originally published Aug 03, 2026 11:08:33, updated Aug 14 2026
Topics: Finance & Accounting Outsourcing, Senior Housing
15 Sep 2026
Every compliance obligation a finance team meets requires data. Be it tax filings, statutory reporti...
Read More14 Sep 2026
A control failure doesn’t announce itself. It hides in the one routine a single trusted person own...
Read More11 Sep 2026
Picture a 90-unit association collecting around $290 a month per home. The books live in a spreadshe...
Read More10 Sep 2026
Late March 2026. Boardrooms across UK hospitality did the same sum. Days before 1 April, the n...
Read More