Topics: KPIs, Manufacturing
Posted on October 02, 2023
Written By Priyanka Rout




The manufacturing industry’s increasing complexity and competitiveness have transformed the role of CFOs in these companies. Today, CFOs aren’t just overseeing financial reporting; they’re pivotal in strategic decision-making and fostering growth. Particularly in manufacturing, CFOs face unique challenges, necessitating a broad skill set and a deep grasp of industry nuances.
That’s precisely why, as a CFO, you must track and analyze key financial metrics. These metrics shed light on the company’s financial health, operational efficiency, and overall performance. This article delves into the top financial metrics that every CFO should monitor to ensure their manufacturing firms stay on a trajectory of success.
Let’s jump right in.
Financial KPIs matter because manufacturing finance is no longer just about reporting what happened last month. It is about spotting where margin, cash and capacity are being quietly lost before those issues reach the board pack.
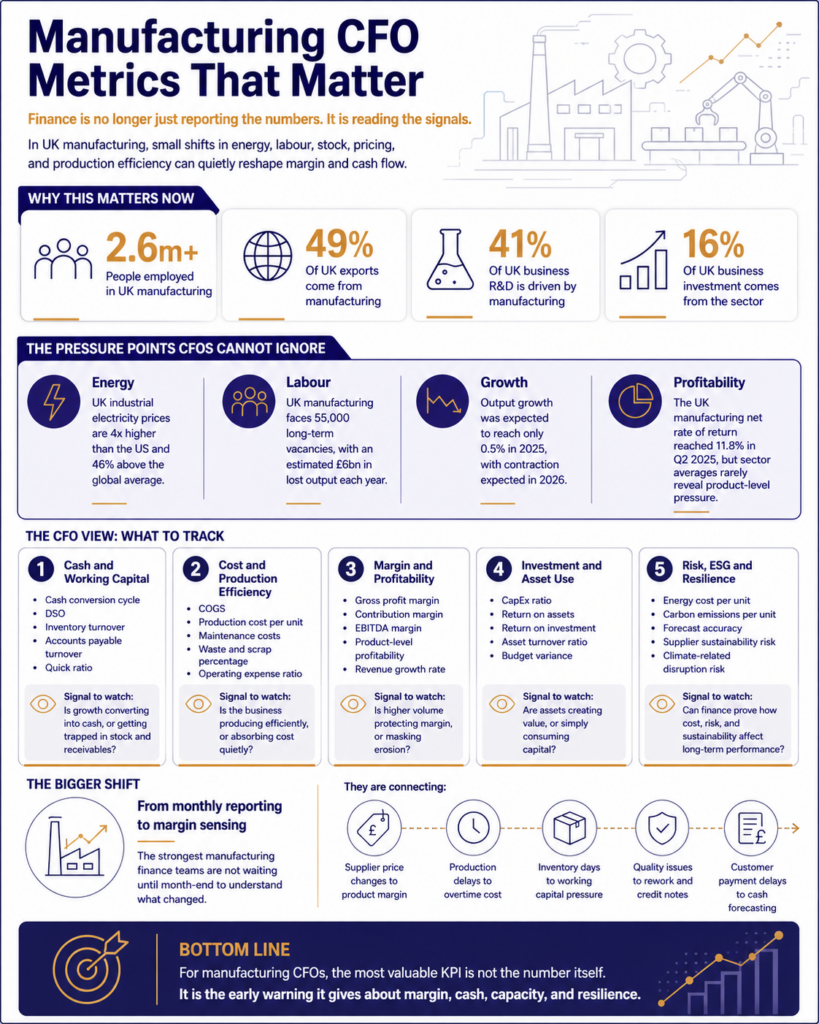
For UK manufacturing CFOs, this is especially important. The sector remains a major part of the economy, employing over 2.6 million people and accounting for 49% of UK exports, 16% of business investment and 41% of business R&D.
That scale makes finance in manufacturing industry settings more exposed to small movements in cost, stock, pricing and working capital.
A one-point movement in gross margin may look manageable on paper. But across multiple product lines, production sites, suppliers and customer contracts, it can quickly affect cash, capacity planning and investment confidence.
For CFOs, the real value of manufacturing financial metrics is not the number itself. It is what the number reveals about the operating model.
Strong CFO metrics help answer questions such as:
This is where manufacturing finance metrics for decision making become more valuable than traditional monthly reporting. They help CFOs move from financial control to commercial visibility.
UK manufacturers are managing a difficult mix of cost pressure, labour constraints, supply chain uncertainty and investment expectations. The challenge is not only that costs are rising. It is that costs are moving unevenly across labour, energy, materials, logistics and compliance.
Make UK’s Q4 2025 Manufacturing Outlook showed that output growth stayed positive and UK orders strengthened, but confidence softened and growth was expected to remain weak, with output up only 0.5% in 2025 and contraction expected in 2026.
That creates a difficult environment for CFOs. A business may still be producing, shipping and winning orders, while profitability becomes harder to protect.
Energy is not just an overhead for many manufacturers. It is a margin driver.
When energy costs move sharply, product-level profitability can change even when sales volumes look healthy. CFOs need to understand whether margins are being protected by pricing discipline, production efficiency or temporary absorption of cost.
This is where manufacturing financial analysis needs to go beyond gross margin. It should connect energy intensity, production runs, machine utilisation and customer pricing.
Skills shortages are not only an HR problem. They affect overtime, productivity, production scheduling, quality control and delivery performance.
Make UK has reported 55,000 unfilled long-term vacancies in UK manufacturing, with an estimated £6 billion in lost output each year.
For CFOs, this means labour-related KPIs need to sit closer to financial reporting. Overtime cost, output per labour hour, rework, absenteeism and training costs can all affect profitability before the impact appears clearly in the P&L.
Manufacturing businesses often have cash tied up long before revenue is collected. Raw materials, work-in-progress, finished goods and customer credit terms all pull cash into the operating cycle.
This is why DSO, inventory turnover, accounts payable turnover and the cash conversion cycle should not be reviewed separately. Together, they show whether growth is being funded efficiently or whether the business is using more working capital to generate the same level of output.
In a more uncertain market, CapEx cannot be assessed only through ROI. CFOs also need to understand whether investment improves resilience, reduces cost-to-serve, supports automation or lowers long-term energy exposure.
For example, replacing ageing equipment may not only reduce maintenance costs. It may also improve energy efficiency, reduce downtime and improve ESG reporting quality.
Many manufacturers still run finance, procurement, production, inventory and sales data across separate systems. This creates a delay between operational reality and financial reporting.
By the time the month-end numbers are reviewed, the cause of margin movement may already be buried in production variance, stock adjustments, supplier pricing or late customer payments.
Benchmarks are useful, but they can also mislead if they are used too broadly. Manufacturing is not one financial profile. A food and drink manufacturer, an automotive supplier, an aerospace component business and an energy-intensive producer will all carry different cost structures, stock cycles and capital requirements.
That is why financial ratios for manufacturing companies in UK markets should be read by subsector, operating model and production cycle, not against one generic manufacturing average.
CFOs should benchmark performance across three layers:
These help CFOs understand the wider trading environment.
For example, ONS data shows that the net rate of return for the UK manufacturing sector increased to 11.8% in Q2 2025, up from 11.4% in Q1 2025.
This gives finance leaders a useful profitability reference point, but it does not explain whether a specific business is outperforming its true peer group.
These show whether the business is converting resources into output efficiently.
Useful operational benchmarks include:
These are often more useful for improving profitability in manufacturing using KPIs than high-level ratios alone.
For CFOs, the most powerful benchmark is often the company’s own trend line.
A current ratio may look acceptable, but if stock ageing is rising and debtor days are worsening, liquidity may be weaker than the headline number suggests. Similarly, a stable gross margin may hide product-level margin erosion if high-margin lines are being replaced by lower-margin volume.
Are:
UK manufacturing is not operating in a normal cost environment. With energy costs, labour pressure, supply chain volatility and tighter margins all shaping boardroom decisions, CFOs need more than standard financial reporting.
Make UK reports that UK industrial electricity prices are four times higher than in the US and 46% above the global average. For manufacturers, this means small movements in cost, inventory or production efficiency can quickly affect profitability.
That is why manufacturing financial metrics should not be treated as isolated numbers. The real value lies in what they reveal about cash, cost, margin, capacity and resilience.
Below are the key CFO metrics that matter most for financial management for manufacturers.
Liquidity metrics help CFOs understand whether the business has enough financial flexibility to meet short-term obligations, fund production and manage pressure across the working capital cycle.
For manufacturing companies, this is especially important because cash is often tied up in raw materials, work-in-progress, finished goods and customer credit terms long before revenue is collected.
The quick ratio shows whether the business can meet short-term liabilities using liquid assets, excluding inventory.
For manufacturing CFOs, this metric matters because inventory may not always be easy to convert into cash quickly. A weak quick ratio may suggest that too much liquidity is locked inside stock, slow collections or operational delays.
The current ratio measures whether current assets are enough to cover current liabilities.
A healthy current ratio gives comfort, but CFOs should look beneath the surface. If the ratio is being supported mainly by slow-moving inventory, the business may look financially stable while still carrying working capital risk.
The cash conversion cycle shows how long it takes to turn raw materials and production activity into cash received from customers.
For manufacturers, this is one of the most important manufacturing finance metrics for decision making. A longer cycle may signal that cash is being trapped in stock, production delays or customer payment terms.
Days sales outstanding, or DSO, measures how long customers take to pay.
Rising DSO can put pressure on cash even when sales are growing. CFOs should read this metric alongside customer concentration, credit terms, dispute levels and sector-specific payment behaviour.
Accounts payable turnover shows how quickly the business pays suppliers.
A slower payment cycle may improve short-term cash, but it can also strain supplier relationships. CFOs need to understand whether payment timing is supporting working capital discipline or creating supply chain risk.
Inventory turnover measures how quickly stock is sold and replaced.
For manufacturing CFOs, this metric should not be read only as an efficiency ratio. It also shows whether demand forecasting, production planning and stock control are aligned.
Low inventory turnover may point to ageing stock, overproduction, weak demand or poor sales and operations planning.
Cost metrics help CFOs see whether the business is producing efficiently or simply absorbing rising costs across materials, energy, labour and maintenance.
In manufacturing, profitability is often lost gradually. It can sit inside overtime, machine downtime, rework, scrap, supplier price increases or poorly planned production runs.
Cost of goods sold, or COGS, measures the direct cost of producing goods sold during a period.
For CFOs, COGS is not just an accounting figure. It shows whether input costs, supplier pricing, labour usage and production efficiency are moving in line with revenue.
If sales are rising but COGS is rising faster, the business may be growing at the expense of margin.
Production costs include the direct and indirect expenses required to convert raw materials into finished goods.
This metric helps CFOs understand the true cost of output. A rise in production costs may be linked to labour inefficiency, energy usage, poor scheduling, downtime or waste.
Maintenance costs show how much the business spends to keep machinery, equipment and production assets running.
CFOs should use this metric to distinguish between necessary asset care and avoidable operational drag. Rising maintenance costs may indicate ageing assets, underinvestment or a need to review CapEx priorities.
This metric shows the cost of producing each unit without including raw material expenses.
It helps CFOs isolate controllable production efficiency. If this number rises, the issue may sit in labour, energy, overhead absorption, machine utilisation or process inefficiency rather than material cost.
The operating expense ratio measures operating expenses as a percentage of revenue.
For manufacturers, this metric helps show whether overheads are scaling sensibly with revenue. If operating expenses rise while production output remains flat, CFOs may need to review site costs, admin structures, support functions or indirect labour.
Profitability metrics help CFOs understand whether the business is generating quality earnings or simply increasing activity without improving financial outcomes.
This is especially important in manufacturing, where higher production volumes can sometimes hide weaker margins, rising working capital and greater operational complexity.
Gross profit margin shows how much revenue remains after deducting the cost of goods sold.
For CFOs, this is one of the most important financial ratios for manufacturing companies in UK markets. A declining gross margin may point to pricing pressure, higher input costs, inefficient production or product mix changes.
Contribution margin shows how much revenue is left after variable costs are deducted.
This metric is useful for understanding which products, customers or contracts genuinely contribute to fixed costs and profit. It can also support pricing, product rationalisation and capacity decisions.
EBITDA margin measures operating profitability before interest, tax, depreciation and amortisation.
For manufacturing CFOs, EBITDA margin gives a clearer view of operating performance before financing and accounting adjustments. It is especially useful when comparing performance across sites, product lines or manufacturing businesses with different capital structures.
Net operating profit shows how profitable the core business is after operating expenses.
This metric helps CFOs understand whether day-to-day manufacturing operations are financially healthy. It is particularly useful when assessing the impact of cost control, process improvement and productivity initiatives.
Net profit margin shows the percentage of revenue that becomes profit after all costs are considered.
For CFOs, this metric connects operational performance with overall financial sustainability. A weak net profit margin may suggest that cost increases, financing costs or overheads are eroding the benefit of revenue growth.
Revenue growth rate measures how quickly sales are increasing over a period.
For manufacturing CFOs, revenue growth should never be viewed in isolation. It needs to be read alongside margin, working capital and production capacity to understand whether growth is profitable and sustainable.
Investment and asset metrics help CFOs understand whether the business is using capital effectively.
Manufacturing is asset-heavy by nature. Machinery, production lines, facilities, automation systems and technology all require careful investment decisions.
The CapEx ratio shows capital expenditure as a proportion of revenue.
CFOs can use this metric to assess whether the business is investing enough to support future capacity, productivity and resilience. Too little CapEx may protect short-term cash but increase long-term operational risk.
Return on assets, or ROA, measures how effectively the business uses its assets to generate profit.
For manufacturers, ROA is especially important because expensive machinery and production facilities need to deliver measurable returns. A low ROA may point to underused assets, weak margins or inefficient production planning.
Return on investment measures the return generated from specific investments.
CFOs can use ROI to assess automation projects, new machinery, plant upgrades, digital tools or process improvement programmes. It helps finance teams decide whether investment is creating financial value or simply adding cost.
The asset turnover ratio shows how efficiently the business uses assets to generate revenue.
For manufacturing CFOs, this metric can reveal whether production assets are being used well. A weak ratio may indicate idle capacity, poor demand planning, inefficient scheduling or underperforming product lines.
Budget variance compares actual performance with budgeted expectations.
This metric helps CFOs understand where assumptions are breaking down. In manufacturing, variances may be caused by raw material costs, labour usage, energy prices, downtime, yield loss or weaker-than-expected demand.
Forward-looking metrics help CFOs see the risks that may not be fully visible in traditional finance reports.
For UK manufacturers, these metrics are becoming more important as businesses face pressure around sustainability, energy efficiency, supply chain resilience and long-term investment planning.
The debt-to-equity ratio compares total debt with shareholder equity.
For CFOs, this metric shows how much the business relies on external borrowing. In a capital-intensive manufacturing environment, it can help assess whether the balance sheet can support future investment without creating excessive financial risk.
Energy cost per unit shows how much energy cost is attached to each unit produced.
This is becoming a critical metric for UK manufacturers. It helps CFOs understand whether energy volatility is affecting product-level profitability and whether efficiency investments are delivering measurable savings.
Waste and scrap percentage measures the proportion of material lost during production.
This metric connects operational quality with financial performance. High scrap levels increase COGS, reduce margin and may signal deeper issues in process control, training, machinery or supplier quality.
Carbon emissions per unit produced links sustainability performance with production output.
For CFOs, this metric can support ESG reporting, customer requirements, procurement discussions and long-term investment decisions. It also helps connect sustainability goals with financial management for manufacturers.
Forecast accuracy measures how closely financial and operational forecasts match actual outcomes.
This is increasingly important for manufacturing financial analysis. Poor forecast accuracy can lead to excess stock, missed production targets, cash flow pressure and weaker board-level confidence.
Product-level profitability shows which products create margin and which absorb capacity without generating enough return.
This is one of the most practical metrics for improving profitability in manufacturing using KPIs. It helps CFOs make better decisions on pricing, product mix, production planning and customer contracts.

Data analytics is changing the role of finance in manufacturing industry settings. The shift is not about creating more dashboards. It is about helping CFOs see the financial impact of operational decisions earlier.
Traditional reporting tells finance what happened. Data analytics helps explain what is changing, where it is changing and what it may cost if the trend continues.
Make UK has highlighted that targeted innovation and digital investment, especially among SMEs, could add £150 billion to UK GDP by 2035. The same report notes that the UK ranks 24th globally for robotics density, showing the scale of the digital adoption gap.
For manufacturing CFOs, this creates a practical opportunity. Better analytics can connect the shop floor to the finance function.
A connected finance data model can show which:
This is where manufacturing finance metrics for decision making become much stronger. CFOs can move from reviewing static KPIs to building early-warning indicators.
The more advanced finance teams are not waiting until month-end to understand margin movement. They are using data analytics to track cost signals during the month.
For example:
This gives CFOs a better view of cause and effect.
Data analytics does not need to begin with a large transformation programme. It can start with a few high-value use cases:
ESG is becoming a finance issue for UK manufacturers, not just a reporting or compliance topic. Energy use, waste, emissions, supplier practices and asset efficiency now have direct implications for cost, investment, risk and access to capital.
The UK government has published finalised UK Sustainability Reporting Standards, UK SRS S1 and UK SRS S2, for voluntary use. The government and FCA will also consider whether certain UK entities should report against these standards in future.
For manufacturing CFOs, the direction of travel is clear. Sustainability data will increasingly need the same level of discipline as financial data.
Manufacturing CFOs should consider bringing the following metrics into management reporting:
These metrics are not separate from financial management for manufacturers. They influence margin, operating cost, CapEx prioritisation and long-term competitiveness.
The CFO is often the person best placed to connect sustainability with commercial performance.
For example:
This is why ESG reporting should not sit only in an annual sustainability document. The most useful ESG metrics are operational, measurable and linked to financial outcomes.
The question is no longer only:
“Are we compliant?”
The better question is:
“Can we prove how sustainability affects cost, risk, resilience and investment returns?”
For UK manufacturers, that question will become more important as customers, investors, lenders and regulators ask for more decision-useful sustainability information.
To make sound decisions and catalyze growth, CFOs need to keep a close eye on the financial metrics outlined above. Relying on data-driven decision-making, based on these metrics, enhances operational excellence and promises enduring success in the ever-evolving manufacturing sector.
However, this is just scratching the surface. Numerous other KPIs require attention to stay competitive in the manufacturing arena. It’s paramount to pinpoint KPIs that resonate with your company’s goals, establish clear and quantifiable targets for each, and consistently observe them using trustworthy financial instruments to guarantee data precision. This is a continuous endeavor.
Regularly examining variances will spotlight areas needing enhancement. Consistency is key. With unwavering observation and adjustments, financial KPIs evolve into potent instruments, pushing growth, efficiency, and your company’s overall financial well-being.
Financial metrics in manufacturing are KPIs that show how well a manufacturer converts materials, labour, machinery, stock and working capital into profitable output. They help CFOs assess cost control, cash flow, production efficiency, margin strength and investment returns.
In 2026, the most important manufacturing finance metrics are those that track cost pressure, cash resilience and margin quality. Key metrics include gross profit margin, COGS, production cost per unit, inventory turnover, cash conversion cycle, DSO, energy cost per unit, EBITDA margin, return on assets and CapEx ROI.
CFOs can improve performance by using metrics to identify where profit, cash or efficiency is being lost. By connecting financial data with production, inventory, procurement and sales data, they can spot margin leakage, reduce working capital pressure and make stronger investment decisions.
Manufacturing CFOs can balance cost control with growth by tracking metrics that show both efficiency and future capacity. Cost-focused KPIs protect margins, while growth-focused metrics such as revenue growth, CapEx ROI, asset turnover and contribution margin show whether expansion is financially sustainable.
Many manufacturing CFOs struggle because profitability is affected by connected factors such as materials, labour, energy, downtime, stock levels, supplier terms and customer payment behaviour. The problem is often not a lack of data, but disconnected finance, production and supply chain systems.
Outdated systems and manual reporting slow down financial visibility because CFOs often receive information after issues have already affected margin or cash flow. Spreadsheets and disconnected systems make it harder to see real-time changes in production cost, inventory, working capital and profitability.

Education:
BA (English Literature); Executive MBA (Marketing)

Priyanka Rout is a B2B marketing professional with 5+ years of experience in marketing, specialising in content-led growth, performance strategy, and sector-driven brand building. She has worked extensively on developing structured marketing programs that align closely with sales priorities, measurable outcomes, and executive-level engagement. At QX Global Group, she leads hospitality-focused marketing initiatives while overseeing central SEO and social media strategy across the UK and USA markets. Working closely with business development and sector leaders, Priyanka develops thought leadership, event-led campaigns, and digital programs that translate complex finance and outsourcing themes into commercially relevant narratives for CFOs and senior decision-makers.
Expertise: B2B Marketing Strategy & Sector Positioning, Hospitality Industry Marketing (UK Focus), Finance & Accounting Services Marketing, Content-Led Growth & Thought Leadership Development, CFO & Executive-Level Content Strategy, Sales Enablement & Marketing Alignment, Event Marketing & Industry-Led Campaigns, SEO Strategy & Organic Growth (UK & USA Markets), Social Media Strategy & Brand Visibility, Outsourcing & Global Delivery Narratives, Industry-Specific Campaign Development, Performance-Driven Digital Marketing Programs
Originally published Oct 02, 2023 09:10:39, updated May 08 2026
Topics: KPIs, Manufacturing
04 Apr 2023
Build to Rent (BTR) is an emerging sector in the UK’s property market that has gained significant ...
Read More